

Many ML practitioners have some intuition about how to make models run fast, but fewer know how to analyze why a model is slow. In Part 1 of this series, you will learn how to systematically analyze inference performance and identify where the time is spent.
This post starts from scratch and assumes no prior profiling experience. The walkthrough uses AWS Trainium, a purpose-built AI chip for deep learning training and inference workloads, and TorchNeuron, its open source native PyTorch backend. TorchNeuron supports standard PyTorch workflows on Trainium, including eager execution, torch.compile, and standard PyTorch APIs, with minimal code changes. Additionally, TorchNeuron integrates with Neuron Kernel Interface (NKI) to enable custom operators and performance optimization for Trainium hardware. By the end, you should know:
- How to configure
torch.profilerwith the Neuron backend and capture a clean trace. - How to read the
key_averages()table to identify which operations consume Neuron device time and compare their Self CPU time. - How to follow one operation through Neuron Explorer, from framework dispatch through runtime scheduling to hardware execution on a NeuronCore.
- How these signals change across three implementations of the same operation.
Neuron as a PyTorch Backend
Before you profile a workload, it helps to understand how Neuron integrates with PyTorch.
The Neuron backend uses PyTorch’s PrivateUse1 extension point. This mechanism lets an accelerator integrate with the framework without adding a dedicated dispatch key such as cuda. The torch_neuronx package works with upstream PyTorch to register Neuron as a native backend for PyTorch code. For details about this extension mechanism, see Facilitating New Backend Integration by PrivateUse1.
Set Up the Profiler
You use two objects to profile a Neuron workload:
NeuronConfigcontrols which Neuron data streams and NeuronCores to capture and where to write the output. You pass it totorch.profiler.profileasexperimental_config.NeuronProfilertakes aNeuronConfigand provides anexport_tracecallback. The callback writes the framework trace,trace.json, alongside the Neuron system traces.
nc = NeuronConfig(
    modes=[ProfileMode.DEVICE, ProfileMode.RUNTIME],
    profile_output_dir=OUTPUT_DIR,
    capture_enabled_for_nc='0',
    correlate_device_time=True,
)
exporter = NeuronProfiler(nc)
The modes parameter selects the data streams to capture, such as device instructions and runtime traces. The capture_enabled_for_nc parameter selects the NeuronCores to trace. Setting correlate_device_time=True propagates device time from the trace into the key_averages() table, where you can compare CPU and Neuron device time. For the complete parameter reference and available ProfileMode values, see the NeuronConfig Profile Modes documentation.
Tooling: Neuron Explorer
Neuron Explorer is a browser-based viewer for the system trace, device timeline, and per-engine breakdown. You can access it through an SSH tunnel or the Visual Studio Code extension. In this post, you use Explorer to confirm what key_averages() reports numerically and inspect what happens between dispatches.
After profiling, the output directory contains the system trace and, when you capture device data, matched .neff and .ntff files. The Neuron Executable File Format (NEFF) contains the compiled Neuron executable, while the matching NTFF contains its hardware instruction trace. The files share a numeric hash that identifies them as a pair. To open the profile in Neuron Explorer, upload the complete output directory for a system or combined profile. For a device-only profile, upload the matching .neff and .ntff files individually. See Step 5: Upload your profile for the UI and command-line instructions.
Profile RMSNorm
For this first analysis, you profile RMSNorm, a small operation with a clear sequence of arithmetic and reduction operations.
You profile three implementations of the same operation:
- Naive RMSNorm with individual PyTorch operations: multiply, mean, add, reciprocal square root, and multiply.
torch.rms_norm(), the PyTorch built-in lowered to a single fused Neuron kernel.- Naive RMSNorm with
torch.compile, using the same operations as the first implementation.
The scripts use the same inputs, profiler configuration, and schedule so the results are directly comparable.
All scripts to reproduce this work are available in the torch-neuronx examples directory.
Profile 1: Naive PyTorch Operations
Start by writing RMSNorm with individual PyTorch operations. Each line maps to one or more ATen operations and can create intermediate tensors.
device = torch.device('neuron')

x = torch.randn(4, 512, dtype=torch.bfloat16, device=device)
weight = torch.ones(512, dtype=torch.bfloat16, device=device)

def rms_norm_fn(t):
    x_sq = t * t
    mean_sq = x_sq.mean(dim=-1, keepdim=True)
    rms = torch.rsqrt(mean_sq + 1e-6)
    return t * rms * weight
Call the profiler with two arguments required for the Neuron backend:
- Include
ProfilerActivity.PrivateUse1to collect activity from the Neuron device. - Pass
NeuronConfigasexperimental_configto enable the Neuron-specific Kineto features.
The schedule uses wait=2, warmup=1, and active=1 across four prof.step() calls. This records one warm iteration without including initial setup overhead.
Call torch.neuron.synchronize() inside the profiler loop. Without this synchronization, the profiler can export before the device finishes and leave the Neuron time column empty.
with torch.profiler.profile(
    activities=[ProfilerActivity.CPU, ProfilerActivity.PrivateUse1],
    experimental_config=nc,
    record_shapes=False,
    on_trace_ready=exporter.export_trace,
    schedule=torch.profiler.schedule(wait=2, warmup=1, active=1),
) as prof:
    for step in range(4):
        with torch.no_grad():
            _ = rms_norm_fn(x)
        torch.neuron.synchronize()
        prof.step()
After profiling finishes, inspect the key_averages() table. Sort by self_privateuse1_time_total to place the operations with the highest device cost first. The table shown here is filtered to the RMSNorm operations that report Neuron device time. The full key_averages() output also includes CPU-side events such as allocations and host-to-device transfers.
print(prof.key_averages().table(sort_by="self_privateuse1_time_total", row_limit=4))

The key averages table shows that three aten::mul calls account for the largest share of Neuron device time.
The table shows which ATen operations ran, how often they ran, and how much time they spent on the CPU and Neuron device. aten::mul has the highest total device time because the function performs three multiplications.
| Name | # Calls | Self CPU | Self NEURON | % NEURON |
|---|---|---|---|---|
| aten::mul | 3 | 60.9 μs | 1,164.5 μs | 49.5% |
| aten::add | 1 | 26.6 μs | 434.6 μs | 18.5% |
| aten::rsqrt | 1 | 15.6 μs | 415.0 μs | 17.6% |
| aten::mean | 1 | 21.1 μs | 340.8 μs | 14.5% |
Self NEURON total: 2.355 ms
Each row maps directly to the function. aten::mul runs for x * x, x * rms, and the final multiplication by weight. aten::mean reduces the last dimension. aten::add adds the epsilon value and triggers a host-to-device copy because the scalar starts on the CPU. aten::rsqrt computes the reciprocal square root.

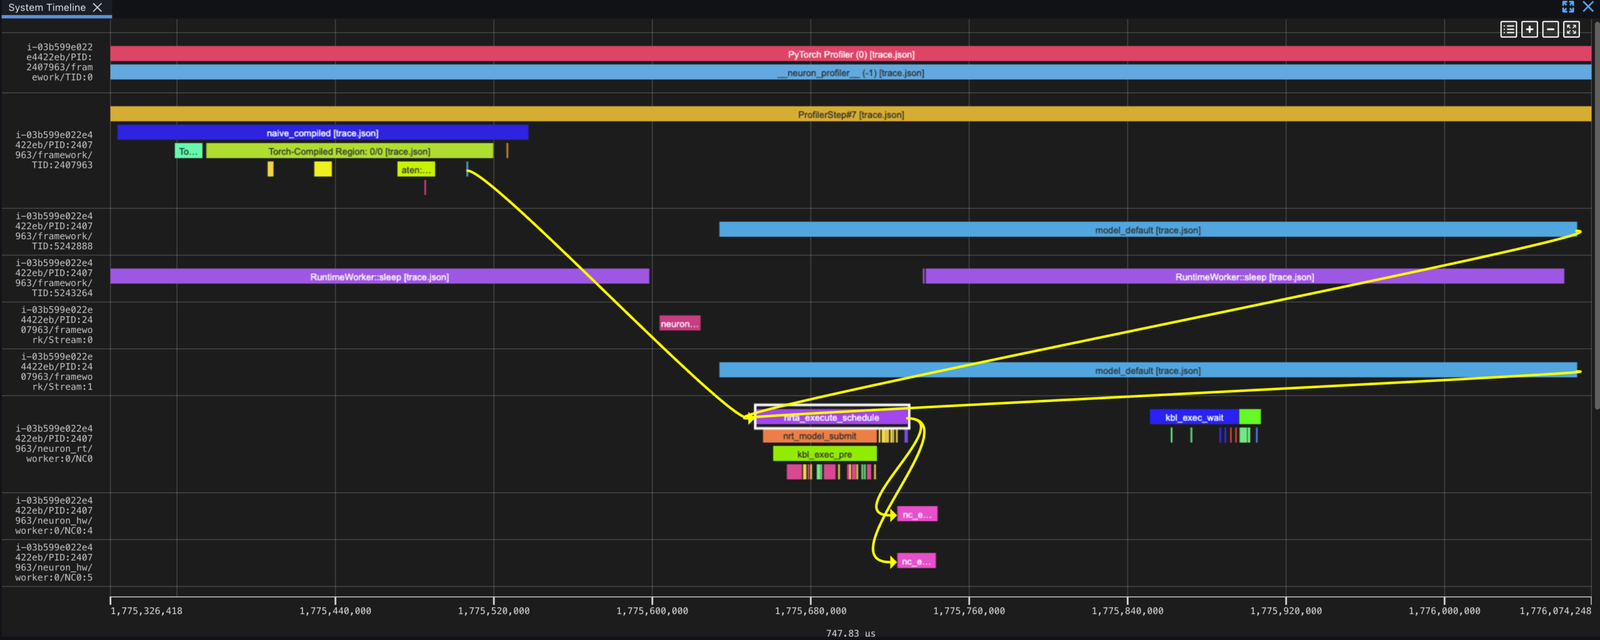
Neuron Explorer follows an aten::mul operation from framework dispatch through runtime scheduling to execution on the Neuron hardware lanes.
Read the Trace in Explorer
In Explorer, time flows from left to right and the event lifecycle flows from top to bottom. Each ATen operation follows the same pattern: creation in the framework lane, scheduling in the runtime lane as nrta_execute_schedule, and device execution in the hardware lane as nc_exec_running.
The system trace view organizes events into lanes. In the Default grouping mode, labels follow the pattern instance/PID/subsystem/identifier:
| Lane | Label suffix | What it shows |
|---|---|---|
| Framework dispatch | framework/TID: |
Operator dispatch events (PrivateUse1 runtime), grouped by thread ID. |
| Framework device | framework/Stream: |
Device interaction events (PrivateUse1 driver), grouped by stream number. |
| Neuron Runtime | neuron_rt/NC: |
Neuron Runtime API calls, grouped by logical NeuronCore. |
| Neuron Hardware | neuron_hw/NC |
Hardware execution events, grouped by physical NeuronCore. |
In eager mode, each operation runs independently. Use the dependency chain viewer to follow aten::mul.Tensor from the framework layer through runtime scheduling to device execution.

The dependency chain viewer highlights the lifecycle of one operation across the framework, runtime, and hardware lanes.
Profile 2: torch.rms_norm
Replace the individual operations with PyTorch’s built-in rms_norm function. Neuron lowers the operation to one fused kernel:
def rms_norm_fn(t):
    return torch.rms_norm(t, [512], weight)

The fused RMSNorm appears as one device operation in the key averages table.
| Name | # Calls | Self CPU | Self NEURON | % NEURON |
|---|---|---|---|---|
| aten::_fused_rms_norm | 1 | 47.6 μs | 403.3 μs | 100% |
Self NEURON total: 403.3 μs

The fused RMSNorm follows one framework-to-hardware path instead of dispatching each arithmetic operation separately.
Compare the Lowering Path
In the naive implementation, each operation crosses the dispatch boundary independently and follows its own framework-to-runtime-to-hardware path. In the fused implementation, one Python call covers the complete computation. The trace contains one dispatch and one hardware event, with no gaps between component operations.
Profile 3: Naive PyTorch with torch.compile
For the final example, compile the original naive RMSNorm function with torch.compile.
With @torch.compile(backend="neuron"), TorchDynamo captures the Python bytecode as an FX graph and AOTAutograd lowers it to ATen operations. The Neuron backend receives the complete graph instead of dispatching each operation separately. It fuses the operations, optimizes memory access, and compiles the graph into a single NEFF artifact. The artifact runs as one hardware dispatch.
@torch.compile(backend='neuron', fullgraph=True)
def naive_compiled(t):
    x_sq = t * t
    mean_sq = x_sq.mean(dim=-1, keepdim=True)
    rms = torch.rsqrt(mean_sq + 1e-6)
    return t * rms * weight

The compiled function appears as one Torch-Compiled Region in the key averages table.
| Name | # Calls | Self CPU | Self NEURON | % NEURON |
|---|---|---|---|---|
| Torch-Compiled Region: 0/0 | 1 | 98.4 μs | 375.5 μs | 100% |
Self NEURON total: 375.5 μs

The compiled graph follows one path through runtime scheduling and hardware execution.
The table shows one device execution, as in Profile 2, but the code takes a different path. Instead of calling a purpose-built fused operation, the compiler discovers the fusion from the original Python function. In this run, the Neuron time is comparable to torch.rms_norm, at 375 μs compared with 403 μs.
Side-by-Side Summary
| Variant | NEURON time | Self CPU time | Operator calls |
|---|---|---|---|
| Naive ops | 2,355 µs | ~125 µs | 6 |
| torch.rms_norm | 403 µs | ~48 µs | 1 |
| Naive + torch.compile | 376 µs | ~98 µs | 1 |
Both torch.rms_norm and torch.compile fuse RMSNorm into one kernel dispatch. In these runs, either approach takes about one-sixth of the naive implementation’s device time. Fusion removes the gaps between hardware executions and avoids materializing intermediate values such as x_sq and mean_sq between separately dispatched operations.
Conclusion
key_averages() shows which operations consume device time, while its full output also reveals CPU-side setup and transfers. Explorer provides the corresponding visual trace. You can follow one operation from framework dispatch through runtime scheduling to hardware execution and see the gaps that fusion removes.
You can use the same workflow on larger models: find a hotspot in the table, verify it in the trace, and then determine whether a fused operation or torch.compile can reduce its cost.
In Part 2, we will move into the device-level profile. You open the NEFF, inspect the TensorEngine, VectorEngine, and direct memory access (DMA) breakdown, and place the kernel on the roofline to determine whether it is compute-bound or memory-bound.
Special thanks to Aritra Roy Gosthipaty for the inspiration to begin this series, and to my peers Pinak Panigrahi, Samir Araujo, Akhil Azhikodan, Esha Lakhotia and the rest for reviewing!
